How to Read Candlestick Charts (Beginner's Guide)
What each part of a candlestick means, how to read bodies and wicks, which time frames day traders use and what patterns can and can’t tell you.
On this page
The short answer: Each candlestick shows four prices for one period of time: the open, high, low and close. The thick body runs from the open to the close. The thin wicks show the high and low. An up candle closes above where it opened. A down candle closes below. Read together, candles show who controlled each period and how hard the other side pushed back.
Key takeaways
- Every candle shows open, high, low and close (OHLC) for one time period.
- The body is open to close. The wicks are the high and low.
- Long wicks mean price was pushed away from that level.
- The time frame changes what each candle covers, not how you read it.
- Candles show what happened, not what will happen next.
What does a candlestick show?
Four prices for one period. On a 5-minute chart, each candle covers five minutes. On a daily chart, one day.
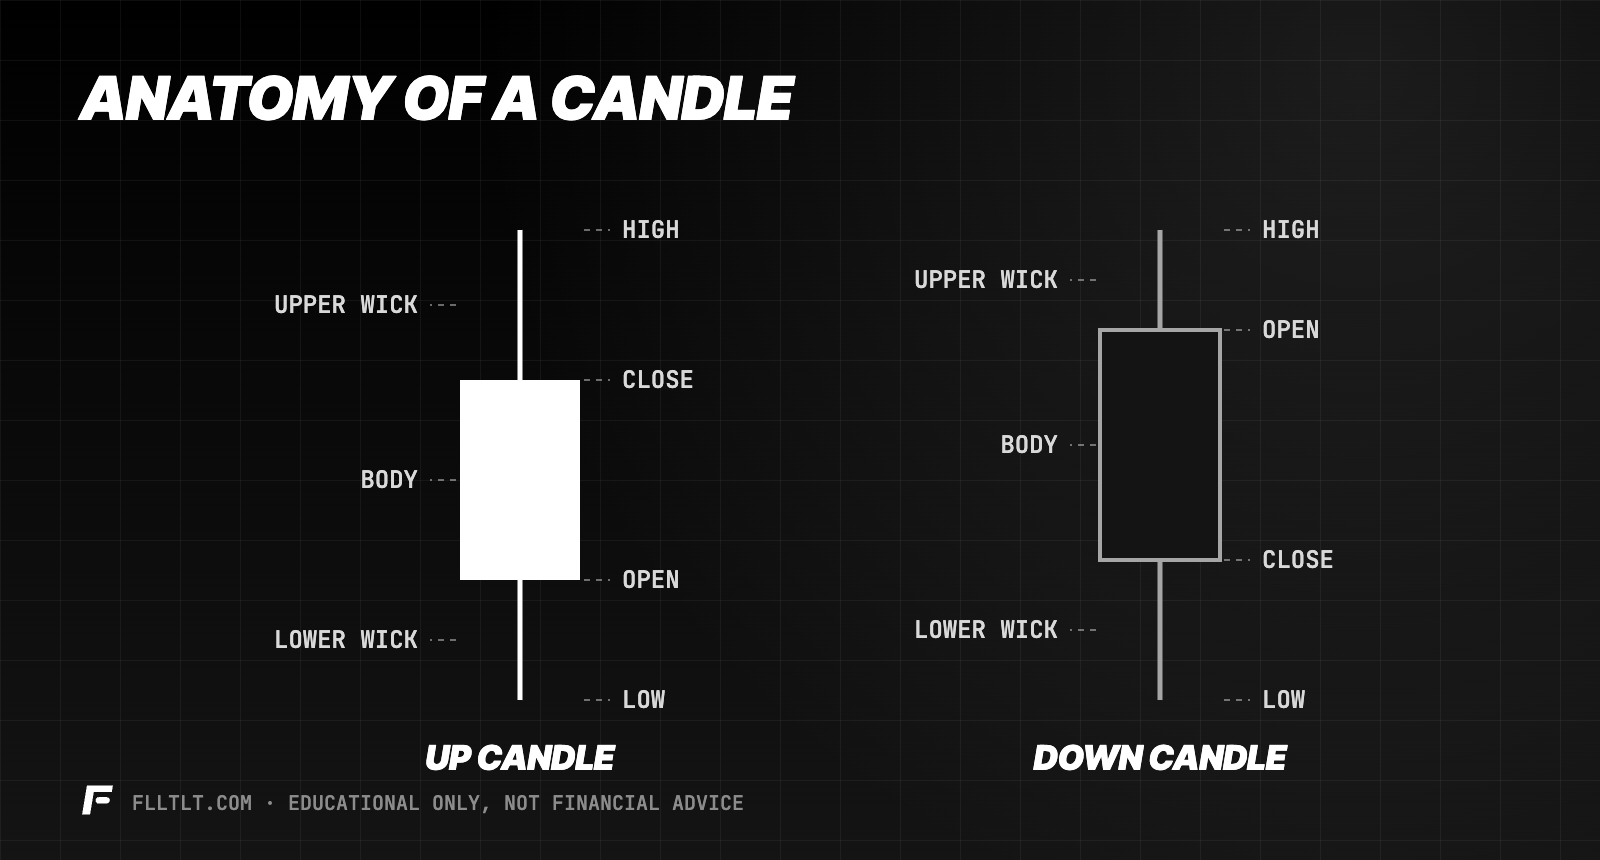
- Open: the first traded price of the period.
- Close: the last traded price.
- High and low: the extremes reached during the period.
- Body: the box between open and close.
- Wicks (or shadows): the lines above and below the body, reaching the high and low.
What do candle colors mean?
Color shows direction. Most platforms show up candles (close above open) in green or white, and down candles (close below open) in red or black. On the charts in this blog, up candles are solid white and down candles are hollow. You can change colors in any charting platform, so always check the settings.
How do you read wicks and bodies?
| What you see | What it suggests |
|---|---|
| Big body, small wicks | One side controlled the whole period |
| Small body, long wicks | Both sides fought; nobody won |
| Long lower wick | Sellers pushed down, buyers pushed back |
| Long upper wick | Buyers pushed up, sellers pushed back |
| No body (open = close) | Indecision, often called a doji |
A single candle is a small piece of information. Context matters more: a long lower wick at a support level means more than the same wick in the middle of nowhere.
Which time frame should you use?
Day traders commonly use 1, 5 and 15-minute charts. Many use a higher time frame for direction and a lower one for entries. A 5-minute candle and a daily candle are read the same way. They just cover different amounts of time, so the levels on higher time frames tend to matter more.
Do candlestick patterns work?
Patterns like hammers, engulfing candles and dojis are descriptions, not predictions. They can help you notice a shift in control, especially at important levels. On their own, they aren't a strategy. Combine them with levels, trend and a defined stop. See the day trading strategies guide.
From the desk Indy trades MNQ on intraday charts and records results in points on Day Trader Income. Every candle is just a record of a fight between buyers and sellers. Knowing who won the last few rounds is useful. Betting the farm on one candle isn't.
The bottom line
Open, high, low, close. The body shows where price started and finished, the wicks show how far it was pushed. Learn to read that, then use candles with levels and trend, never on their own. Next, learn what each point is worth in tick value and point value.
FAQ
How do you read a candlestick chart?
Each candle shows the open, high, low and close for one time period. The body runs from open to close, and the wicks show the high and low.
What does a green or red candle mean?
Usually, green (or white) means the period closed higher than it opened, and red (or black) means it closed lower. Colors can be changed in chart settings.
What does a long wick mean?
A long wick shows price moved to a level during the period but was pushed back. A long lower wick means sellers pushed down and buyers pushed back up.
What time frame is best for day trading?
Many day traders use 1, 5 and 15-minute charts, often with a higher time frame for direction and a lower one for timing entries.
Do candlestick patterns predict price?
No. Patterns describe what happened and can highlight shifts in control, but they are not reliable predictions on their own.