Support and Resistance: How to Find and Trade Key Levels
What support and resistance are, which levels day traders watch, how to trade the bounce and the break, and where the stop goes.
On this page

The short answer: Support is a price level where buying has stopped declines before. Resistance is a level where selling has stopped rallies. Traders draw them from prior highs and lows, then use them to plan entries, stops and targets. When resistance breaks, it often becomes support on the retest, and the reverse. Levels are zones, not exact prices, and the more obvious a level is, the more traders are watching it.
Key takeaways
- Support stops declines. Resistance stops rallies. Both come from prior turning points.
- Treat levels as zones a few ticks wide, not single prices.
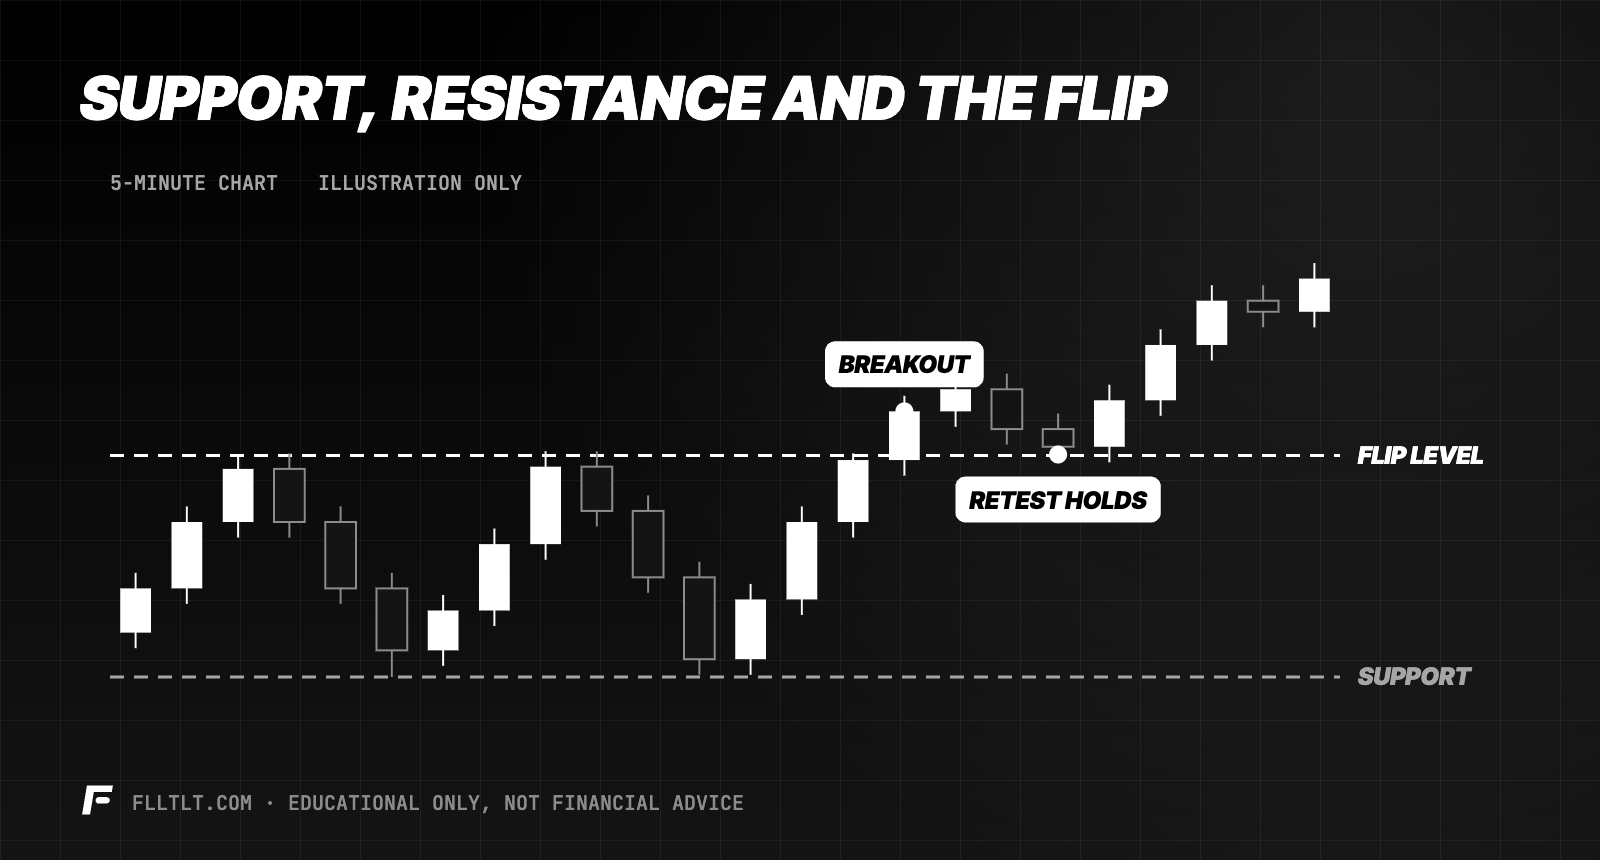
- Broken resistance often becomes support, and broken support becomes resistance.
- Stops go beyond the level, not right on it.
- The more times a level is tested, the more likely it eventually breaks.
What are support and resistance?
Prices where the market has turned before. At support, buyers stepped in and pushed price up. At resistance, sellers stepped in and pushed it down. Traders remember those levels, place orders around them, and that's part of why price often reacts there again.
How do you find support and resistance levels?
Start with the levels everyone can see. For day traders, the most-watched ones are:
- Prior day high and low.
- Overnight (globex) high and low on futures.
- The opening range high and low. See opening range breakout.
- Clear swing highs and lows on your chart where price turned sharply.
- Round numbers, like 20,000 on the Nasdaq-100.
Mark a handful before the open. If your chart has 15 lines on it, none of them mean anything.
How do you trade support and resistance?
Two basic ways: the bounce and the break.
| Bounce | Break and retest | |
|---|---|---|
| Idea | Level holds, price turns | Level breaks, then holds from the other side |
| Entry | At the level after a rejection candle | On the retest of the broken level |
| Stop | Just beyond the level | Back on the wrong side of the level |
| Fails when | The level breaks | The breakout was false |
In the chart above, 110 capped price three times. When it finally broke, the next pullback came back to 110 and held. That's the flip: old resistance acting as new support.
Where should the stop go?
Beyond the zone, with a little room. Placing a stop exactly at the level means normal noise around it can stop you out before the move. Put it a few ticks past the zone, then size the position to fit. More in position sizing for futures.
Why do levels break?
Because every test uses up the orders defending it. The first touch of a level usually has the most buyers or sellers waiting. By the third or fourth test, many of those orders have been filled. That's why a level tested again and again often breaks eventually, and why the break can move fast.
From the desk Indy trades MNQ and records results in points on Day Trader Income. Levels are how a points-based stop gets decided: the stop goes on the far side of the level, and the distance in points sets the size.
Common mistakes
- Too many lines. Mark the obvious levels and ignore the rest.
- Exact-price thinking. Price rarely turns at the same tick twice. Use zones.
- Fading every level. On strong trend days, levels break. Don't keep fighting the trend.
- Stops on the line. Give the trade room beyond the zone.
The bottom line
Support and resistance are the map most other strategies are drawn on. Mark the obvious levels, treat them as zones, put stops beyond them and watch for the flip after a break. For how levels fit with other approaches, read the day trading strategies guide.
FAQ
What is support and resistance in trading?
Support is a price level where buying has stopped declines before. Resistance is a level where selling has stopped rallies. Traders use both to plan entries, stops and targets.
How do you find support and resistance levels?
Start with widely watched levels: the prior day high and low, the overnight high and low, the opening range, clear swing highs and lows, and round numbers.
Does resistance become support?
Often, yes. When price breaks above resistance, that level frequently acts as support on the retest. The same works in reverse for broken support.
Where should I put a stop with support and resistance?
A few ticks beyond the support or resistance zone, not exactly on the level, so normal noise does not stop you out.
Why do support and resistance levels break?
Each test fills some of the orders defending the level. After several tests, fewer orders remain, which makes a break more likely.